Month End Financial Projections
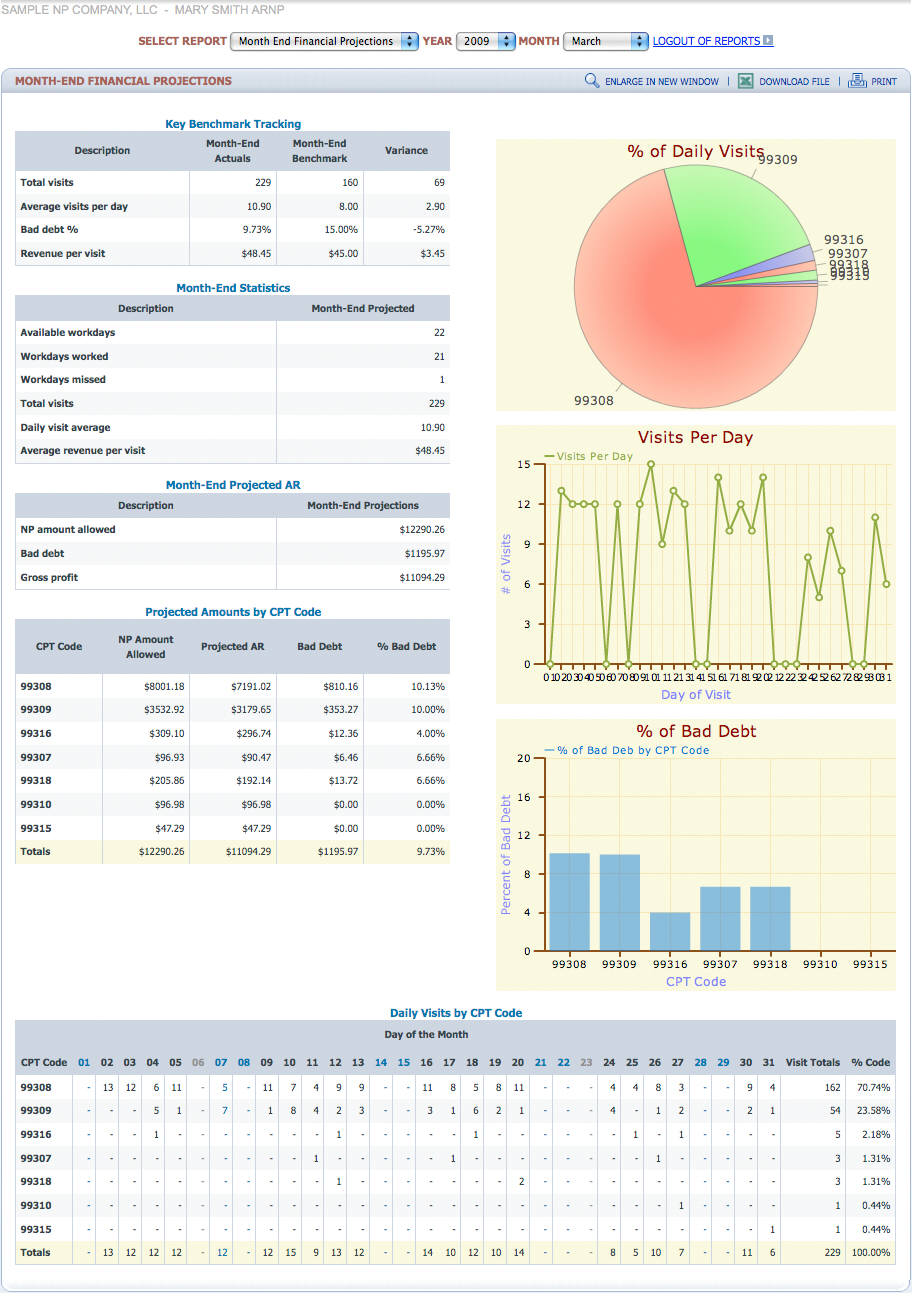
The Month End Financial Projections report displays information based on the actual services provided for the selected month. The report includes a benchmark analysis comparing the month end data to the benchmarks the practitioners set for themselves. The report also displays a graph showing the breakdown of procedures and services provided during the selected month. This graphic representation can be used to analyze coding trends that may need to be changed.
Other information displayed on the Month End Financial Projections report shows the actual revenue, projected bad debt and projected gross profit. There is a breakdown by procedure code displaying revenue per procedure code and projected bad debt by procedure code. A useful graph in this section of the report visually shows the visits per day. It is easiier to visually see work habit trends. For example a practitioner can see if they may tend to see more patients at the beginning of the week verses the end of the week. The last section of the Month End Financial Projections report show a detailed display of the visit per day broke down by procedure. The practitioner can review this report to insure that all services were received and billed by our staff.
Other information displayed on the Month End Financial Projections report shows the actual revenue, projected bad debt and projected gross profit. There is a breakdown by procedure code displaying revenue per procedure code and projected bad debt by procedure code. A useful graph in this section of the report visually shows the visits per day. It is easiier to visually see work habit trends. For example a practitioner can see if they may tend to see more patients at the beginning of the week verses the end of the week. The last section of the Month End Financial Projections report show a detailed display of the visit per day broke down by procedure. The practitioner can review this report to insure that all services were received and billed by our staff.